Extending Experience Analytics reports
Sitecore 8
This article provide really short introduction into creating of custom reports for Experience Analytics. In Sitecore terms I would say : to create new report dimensions and appropriate reports for showing them. This article looks like really short step-by-step guide with few screenshot and without any extended documentation and explanation. I hope that that will come a bit later.
So, the task to do: let’s implement new report that shows statistic of visits/value by different web browsers. This report can help marketing people to discover which browsers do visitors use, which browser bring more value etc.
Creating new dimension
Step 1: create a new dimension definition item
Create new “Dimension” item under “/sitecore/system/Marketing Control Panel/Experience Analytics/Dimensions/Visits” (Just use right click on the parent) and give it name “By Browser Version”.
Appropriate dimension item as well as segment item will be created.
Let’s also rename segment item to something better. So finally it will look like this:
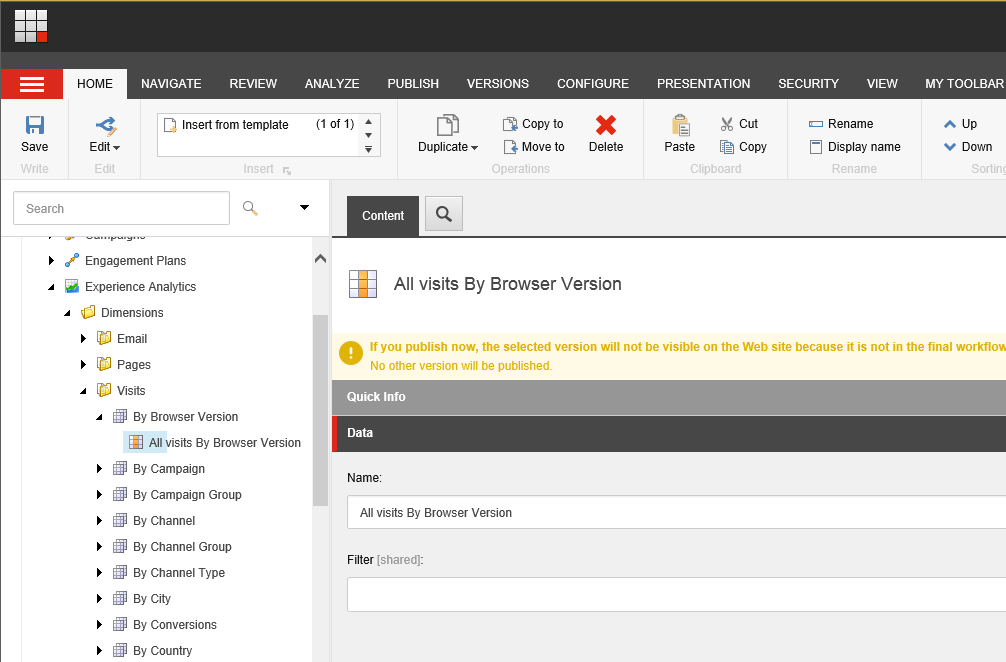
Deploy the segment item: go to item “/sitecore/system/Marketing Control Panel/Experience Analytics/Dimensions/Visits/By Browser Version/All visits By Browser Version” in Content Editor, and hit “Deploy” button in “Review” tab of ribbon.
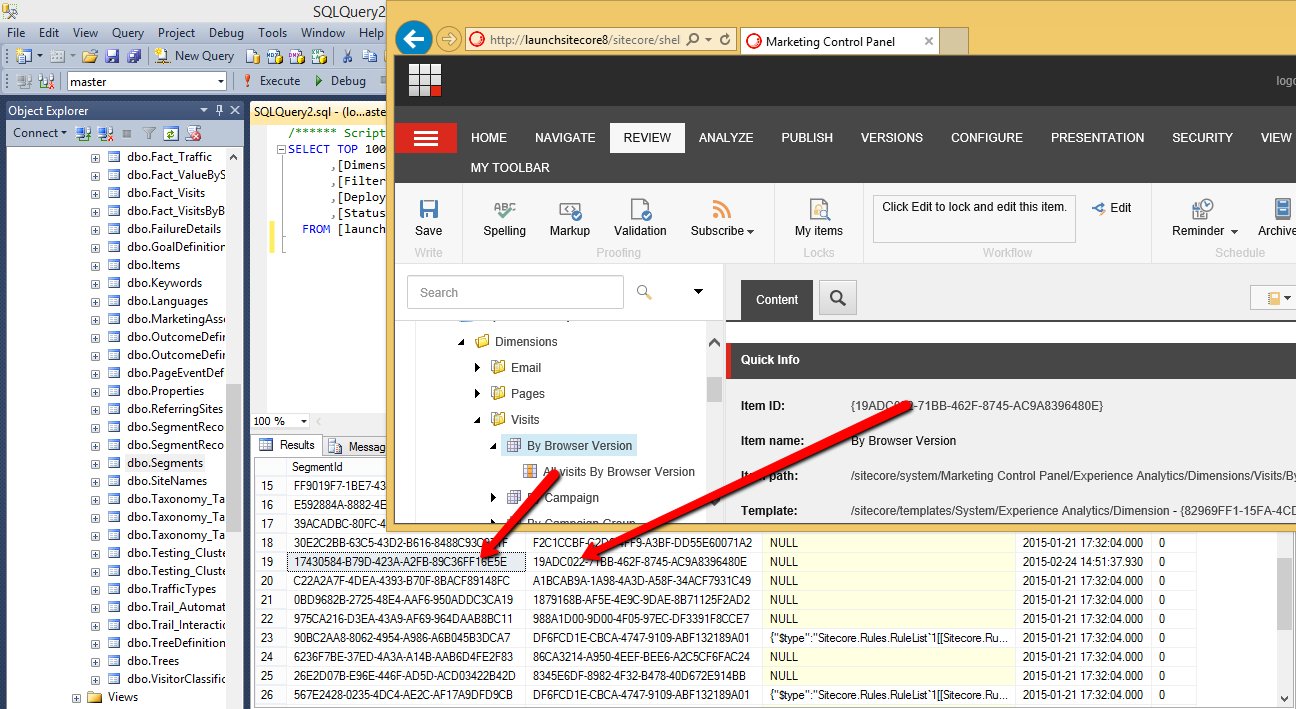
Right after that you’ll have new record added to Segments table of reporting database. Take into account IDs in that DB record that are actually IDs of appropriate Dimension and Segment definition items:
Update “DeployDate” field value of that record in DB to some older value (minimum 30 min. less) in order to make xDB to process data. The reason, visit will be processed by the segment if:
visit.SaveDateTime > segment.DeployDate + 30 min)
Step 2: create and register new dimension class in config
You can create new separate standalone (class library) project in Visual Studio as well as using existing one.
Make sure 3 following Sitecore assemblies are referenced there:
* Sitecore.Analytics.Aggregation.dll
* Sitecore.Analytics.Model.dll
* Sitecore.ExperienceAnalytics.dll
Create new class called “ByBrowserVersion” and inherit that from either DimensionBase or VisitDimensionBase base class. Let’s use the second one in this example.
2 abstract methods need to be implemented. Let’s do some simple implementation:
```csharp using System; using Sitecore.Analytics.Aggregation.Data.Model; using Sitecore.ExperienceAnalytics.Aggregation.Dimensions;
namespace Sitecore.EADemo { class ByBrowserVersion : VisitDimensionBase { public ByBrowserVersion(Guid dimensionId) : base(dimensionId) { }
protected override bool HasDimensionKey(IVisitAggregationContext context)
{
  // check browser data whether it is available
  return !string.IsNullOrEmpty(context.Visit.Browser.BrowserMajorName) &&
         !string.IsNullOrEmpty(context.Visit.Browser.BrowserVersion);
}

protected override string GetKey(IVisitAggregationContext context)
{
  // making key for the dimension
  return string.Format("{0}-{1}", context.Visit.Browser.BrowserMajorName, context.Visit.Browser.BrowserVersion);
}   } } ```
In case of using “DimensionBase” the custom class would look like this:
```csharp using System; using System.Collections.Generic; using Sitecore.Analytics.Aggregation.Data.Model; using Sitecore.ExperienceAnalytics.Aggregation.Data.Model; using Sitecore.ExperienceAnalytics.Aggregation.Dimensions;
namespace Sitecore.EADemo { class ByBrowserVersionV2 : DimensionBase { public ByBrowserVersionV2(Guid dimensionId) : base(dimensionId) { }
public override IEnumerable<DimensionData> GetData(IVisitAggregationContext context)
{
  var key = string.Format("{0}-{1}", context.Visit.Browser.BrowserMajorName, context.Visit.Browser.BrowserVersion);

  // point of changing calculations that comes from base class
  // everything can be changed
  var calculations = CalculateCommonMetrics(context);
  calculations.Bounces = 15;

  yield return new DimensionData
  {
    DimensionKey = key,
    MetricsValue = calculations
  };
}   } } ```
Build project and make sure the dll is copied to bin folder of the website.
Map created class to appropriate item in Sitecore - add line similar to following to <dimensions> section of “Sitecore.ExperienceAnalytics.Aggregation.config” file:
<dimension id="{19ADC022-71BB-462F-8745-AC9A8396480E}" type="Sitecore.EADemo.ByBrowserVersion, Sitecore.EADemo" />
The id in my case is the ID of item “/sitecore/system/Marketing Control Panel/Experience Analytics/Dimensions/Visits/By Browser Version”, Namespace, class and assembly name are of the one which has been just created.
Important: ID of Dimension (not a Segment) item should be used for mapping.
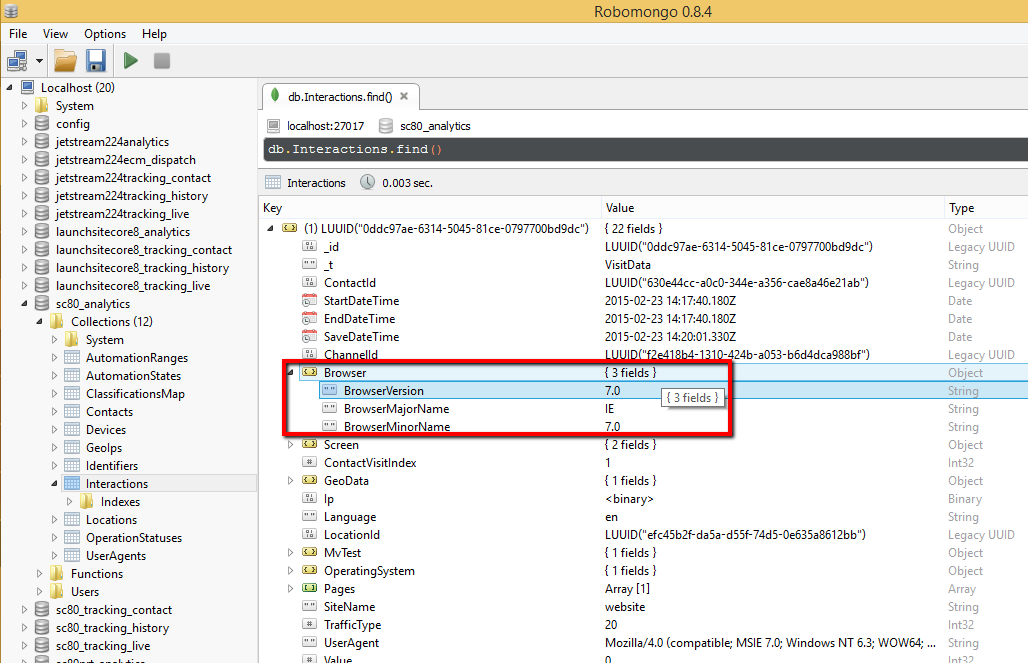
To check that it works, remove all data from Interaction table of Analytics DB in MongoDB and generate some Visits by visiting website from different browsers. (see some more tips and tricks how to get data flushed to MongoDB quicker).
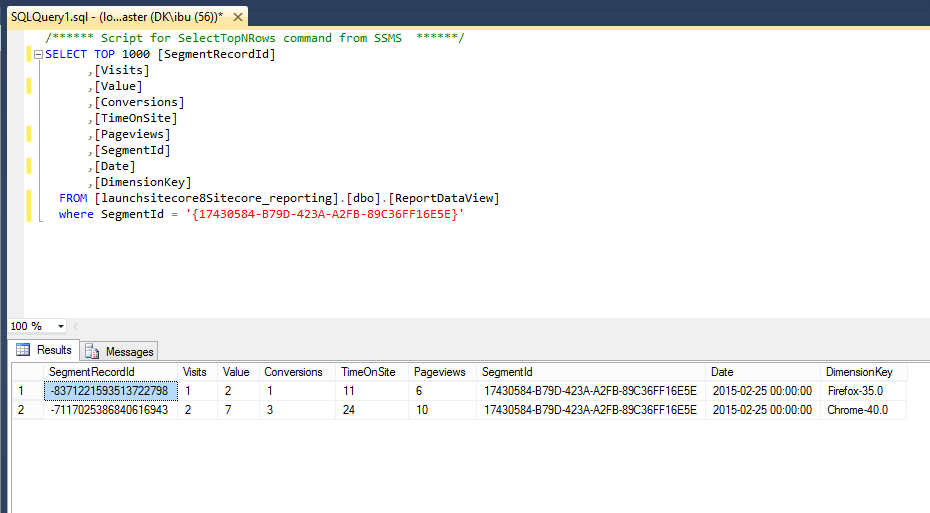
Select data from dbo.ReportDataView view if reporting DB using following query:
sql
SELECT TOP 1000 [SegmentRecordId]
      ,[Visits]
      ,[Value]
      ,[Conversions]
      ,[TimeOnSite]
      ,[Pageviews]
      ,[SegmentId]
      ,[Date]
      ,[DimensionKey]
  FROM [launchsitecore8Sitecore_reporting].[dbo].[ReportDataView]
  where SegmentId = '{17430584-B79D-423A-A2FB-89C36FF16E5E}'
The SegmentID in this case is ID of appropriate segment item (“/sitecore/system/Marketing Control Panel/Experience Analytics/Dimensions/Visits/By Browser Version/All visits By Browser Version” in this example).
So, you should see some data that was aggregated using this custom dimension. Something like following one:
Creating new report
Step 1: create reporting page in EA (Experience Analitycs) using Sitecore Rocks
Now we need to visualize the data that we got on previous steps. For that we will just copy existing report, and do some changes there.
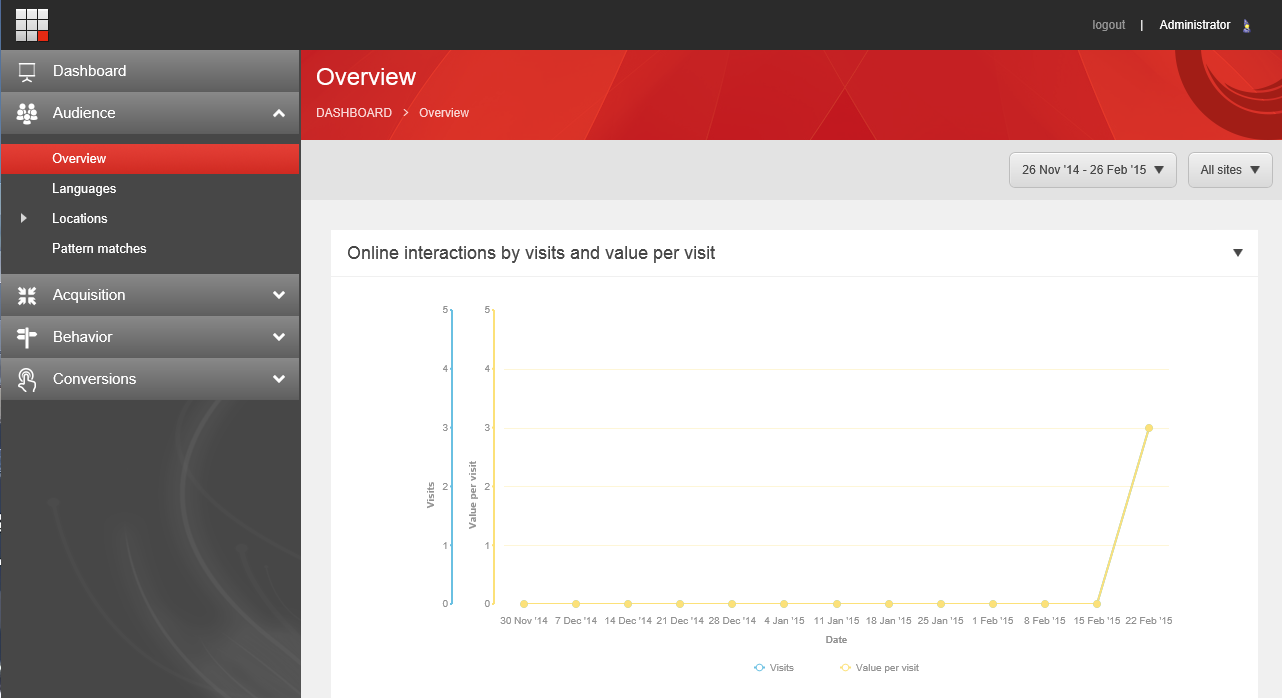
Let’s use “Overview” report in “Audience”:
- Open the solution in Sitecore Rocks and duplicate the item “/sitecore/client/Applications/ExperienceAnalytics/Dashboard/Audience/Overview” with subitems.
- Rename that new item to “Browsers”.
- Remove all the children of “Browsers/PageSettings” item except stylesheet and “All visits” item.
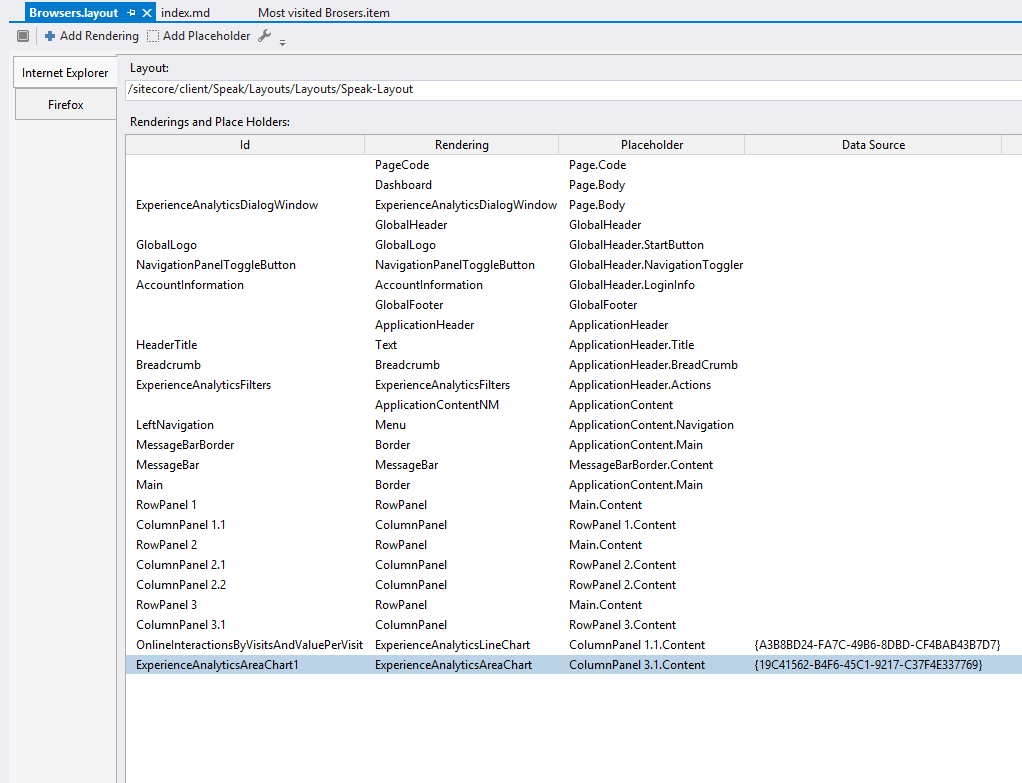
- Design layout in Sitecore Rocks on “/sitecore/client/Applications/ExperienceAnalytics/Dashboard/Audience/Browsers” item and remove all the visualizations except of one line chart. So layouts will look like this:
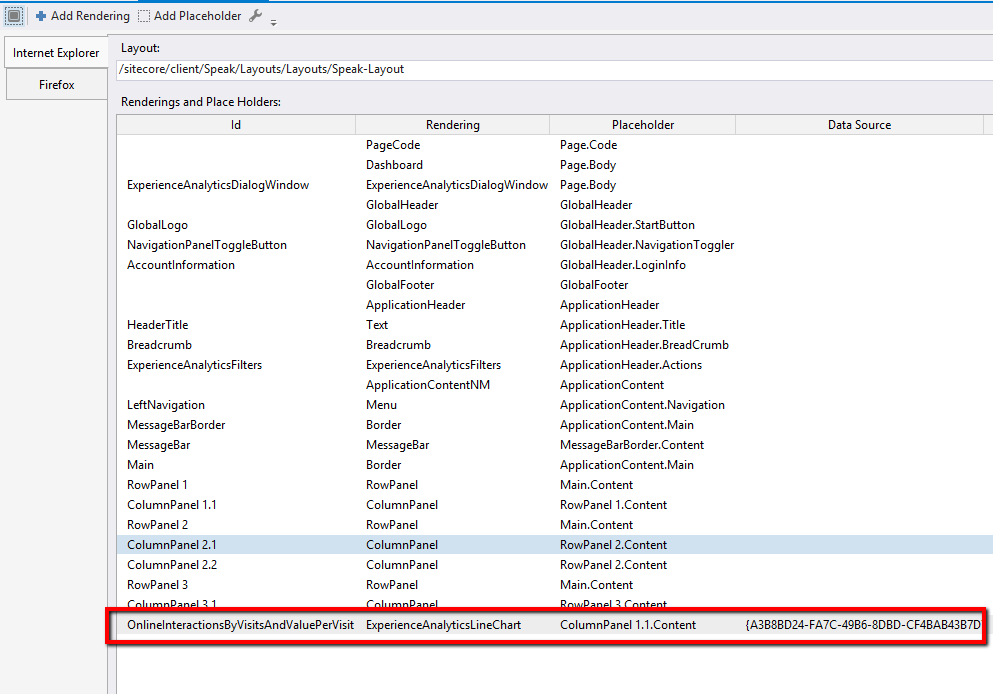
- Fix datasource line chart control (latest control on screenshot above) in order to remap it to “All Visits” item under “Browsers” report (in this example it should be remapped to “/sitecore/client/Applications/ExperienceAnalytics/Dashboard/Audience/Browsers/PageSettings/All Visits” item)
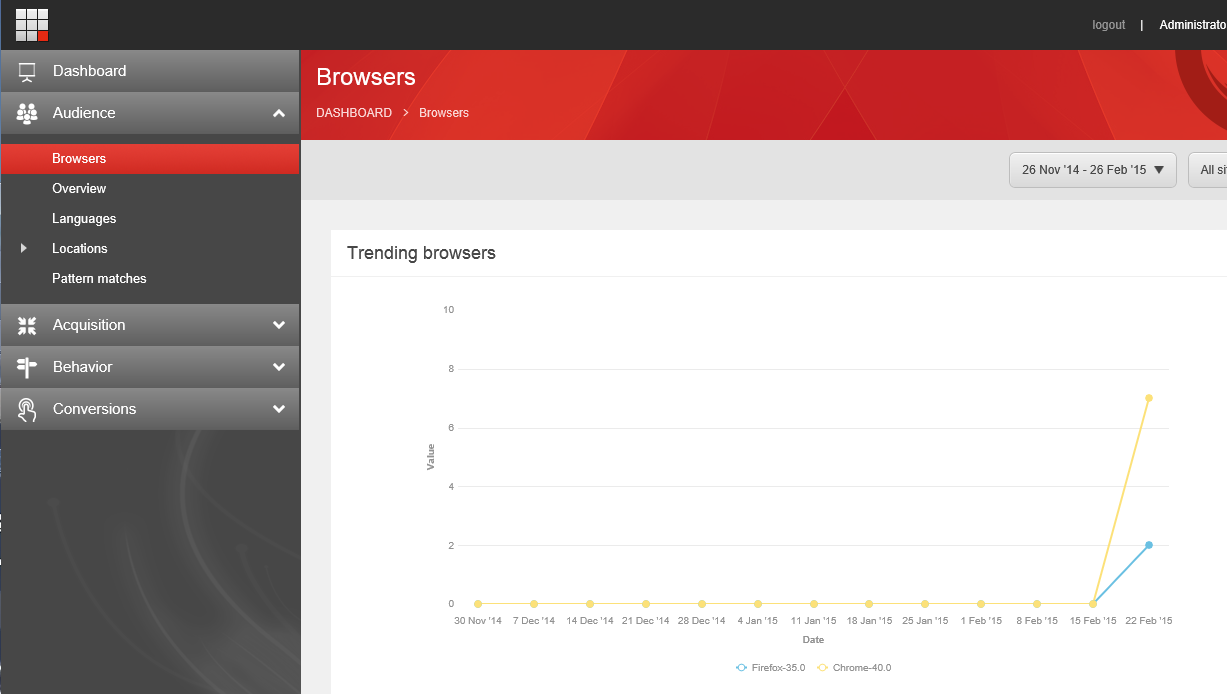
- Rename that “All visits” item to something more meaningful, for example “Trending browsers”.
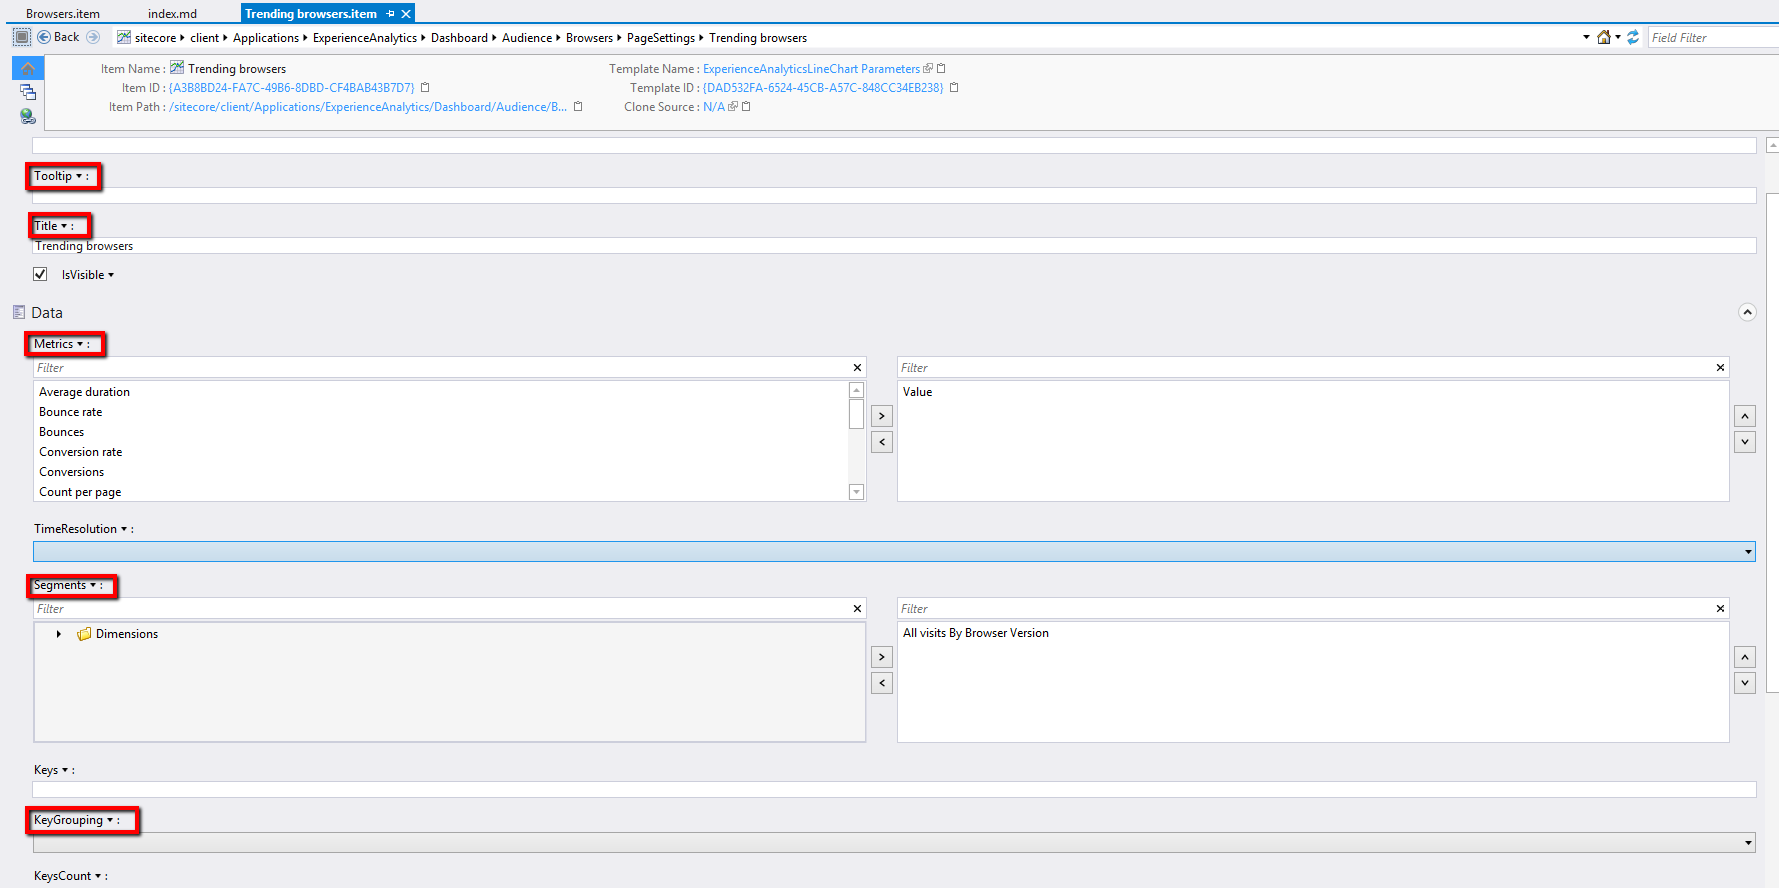
- Update some fields of “/sitecore/client/Applications/ExperienceAnalytics/Dashboard/Audience/Browsers/PageSettings/Trending browsers” item:
- “Tooltip” and “Title” field with better text, e. g. “Trending browsers”.
- “Metrics” field - select only “Value” as a metric to show (for simplicity sake).
- “Segments” field - the most important for us one. Select “All visits by Browser Version” segment that we have created in this guide above.
- “Key Grouping” field - change to empty selection.
- Go to Experience Analytics and check out Browsers report.
Let’s add one more chart (area chart) to the report that will show us Top Visited browsers. We need to do following actions for that:
* Add new item from template “ExperienceAnalyticsAreaChart Parameters” under “/sitecore/client/Applications/ExperienceAnalytics/Dashboard/Audience/Browsers/PageSettings”, let’s call that “Most Visited Browsers”.
* Configure some fields in newly created item:
1. Title.
2. Metrics: select “Visits” option.
3. TimeResolution: select “Daily”.
4. Segment (we need to use the same segment as above).
5. KeysCount to 2 or 3 (depending of how much data you have generated in xDB). It will actually shows you Top N of the most visited browsers.
6. KeySortByMetrics: select “Visits” option.
7. KeySortDirection: select “Descending” option.
* Add “ExperienceAnalyticsAreaChart” rendering to layouts of “Browsers” report item (using Design Layout of Sitecore Rocks) and map its datasource to the item created in previous step.
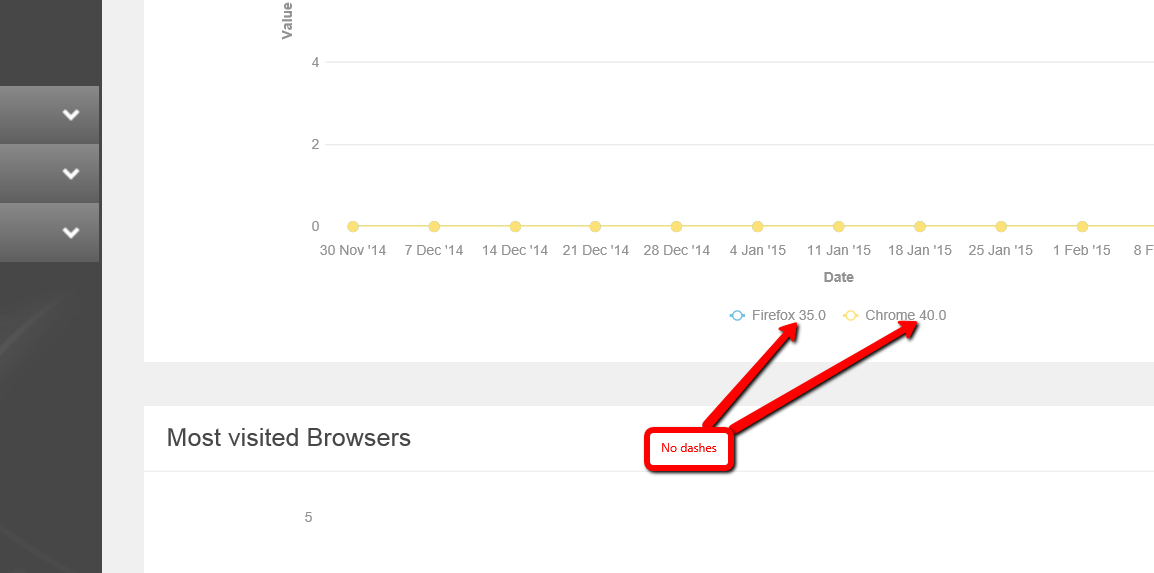
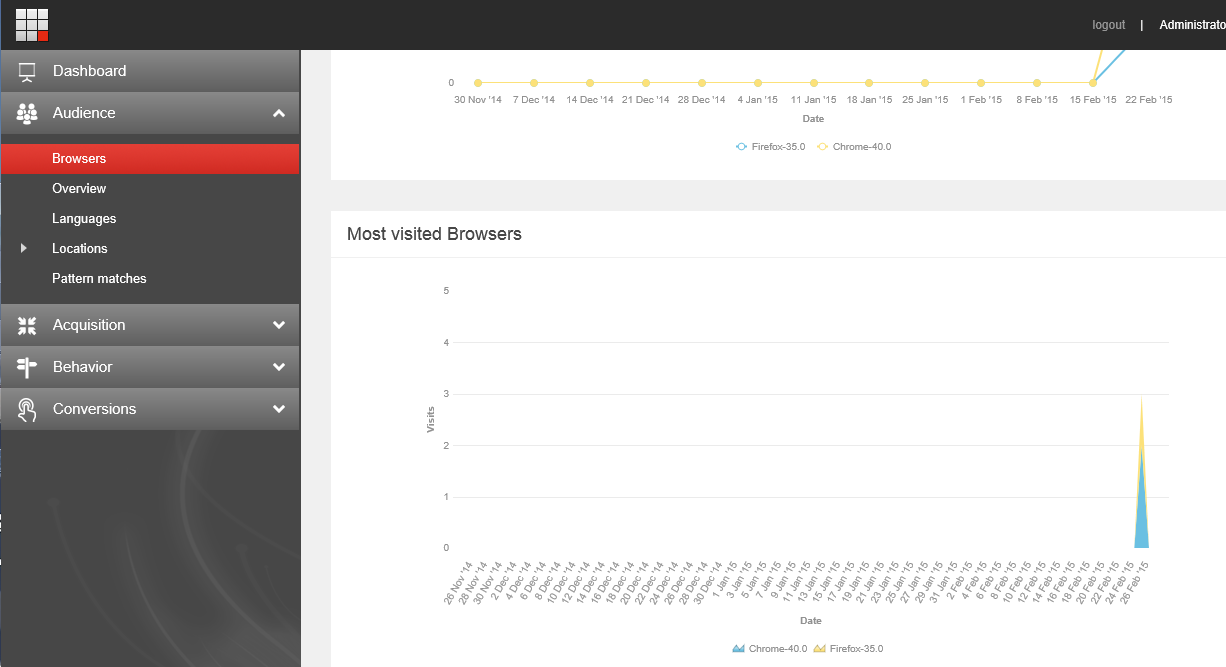
 * Check out the report and see area chart there:
Step 2: create a dimension key transformer for the new dimension (optional)
Really quick about dimension key transformers.
This step is related to explain how to transform Dimension Key (remember “Chrome-24” from previous steps) in order to get something more human readable for report UI (for example browser name and version without ugly dash character).
The config for that is “Sitecore.ExperienceAnalytics.WebAPI.config”. A transformer can be associated with appropriate dimension in similar way:
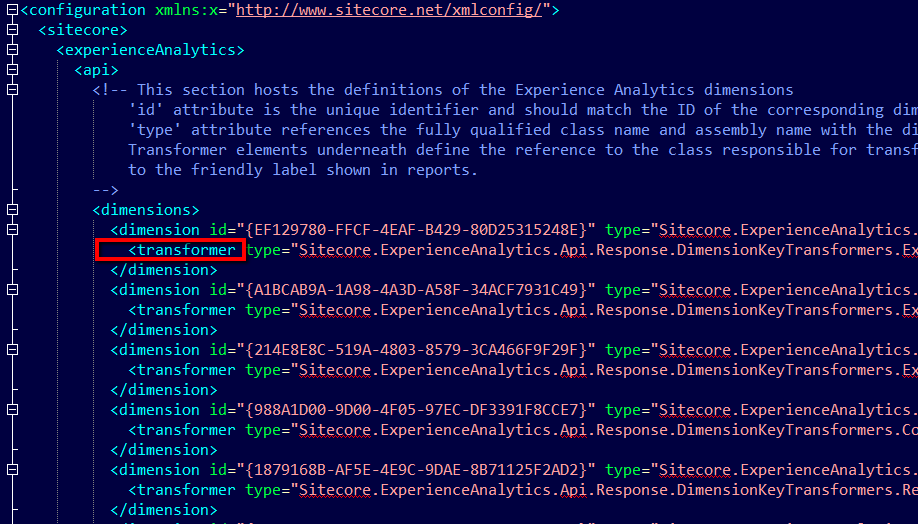
So our dimension should be placed in that config (see screenshot below) file and appropriate transformer needs to be developer and referenced there.
The code of transformer for removing a dash from the dimension key might look like following one:
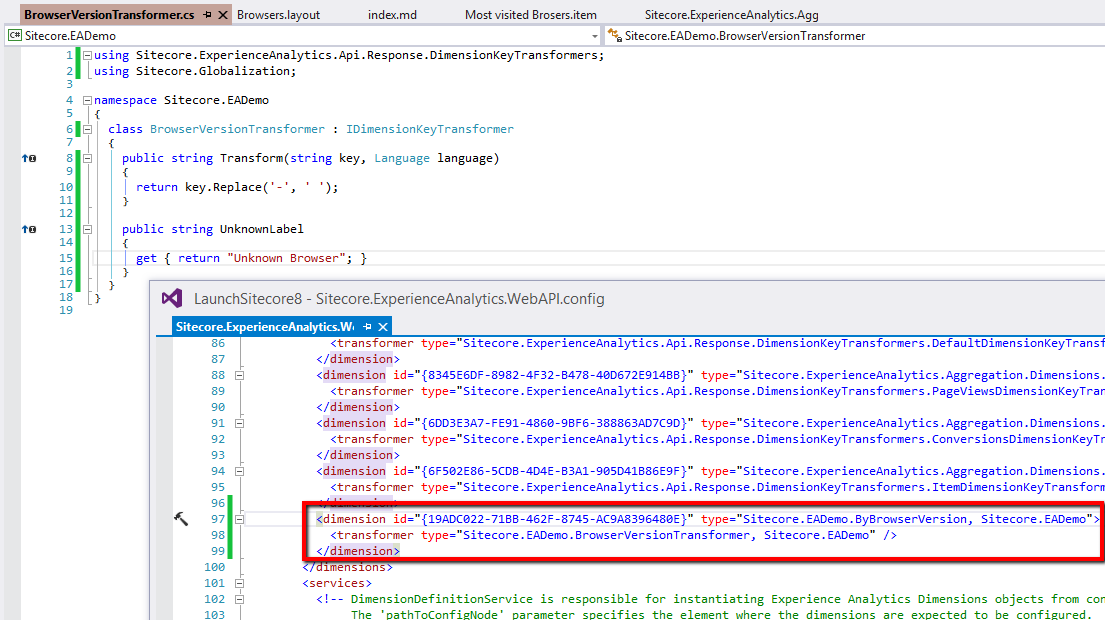
After implementing that, you will see something like this: